Determining What You – And Your Lender – Feel You Can Borrow
Determining What You – And Your Lender – Feel You Can Borrow
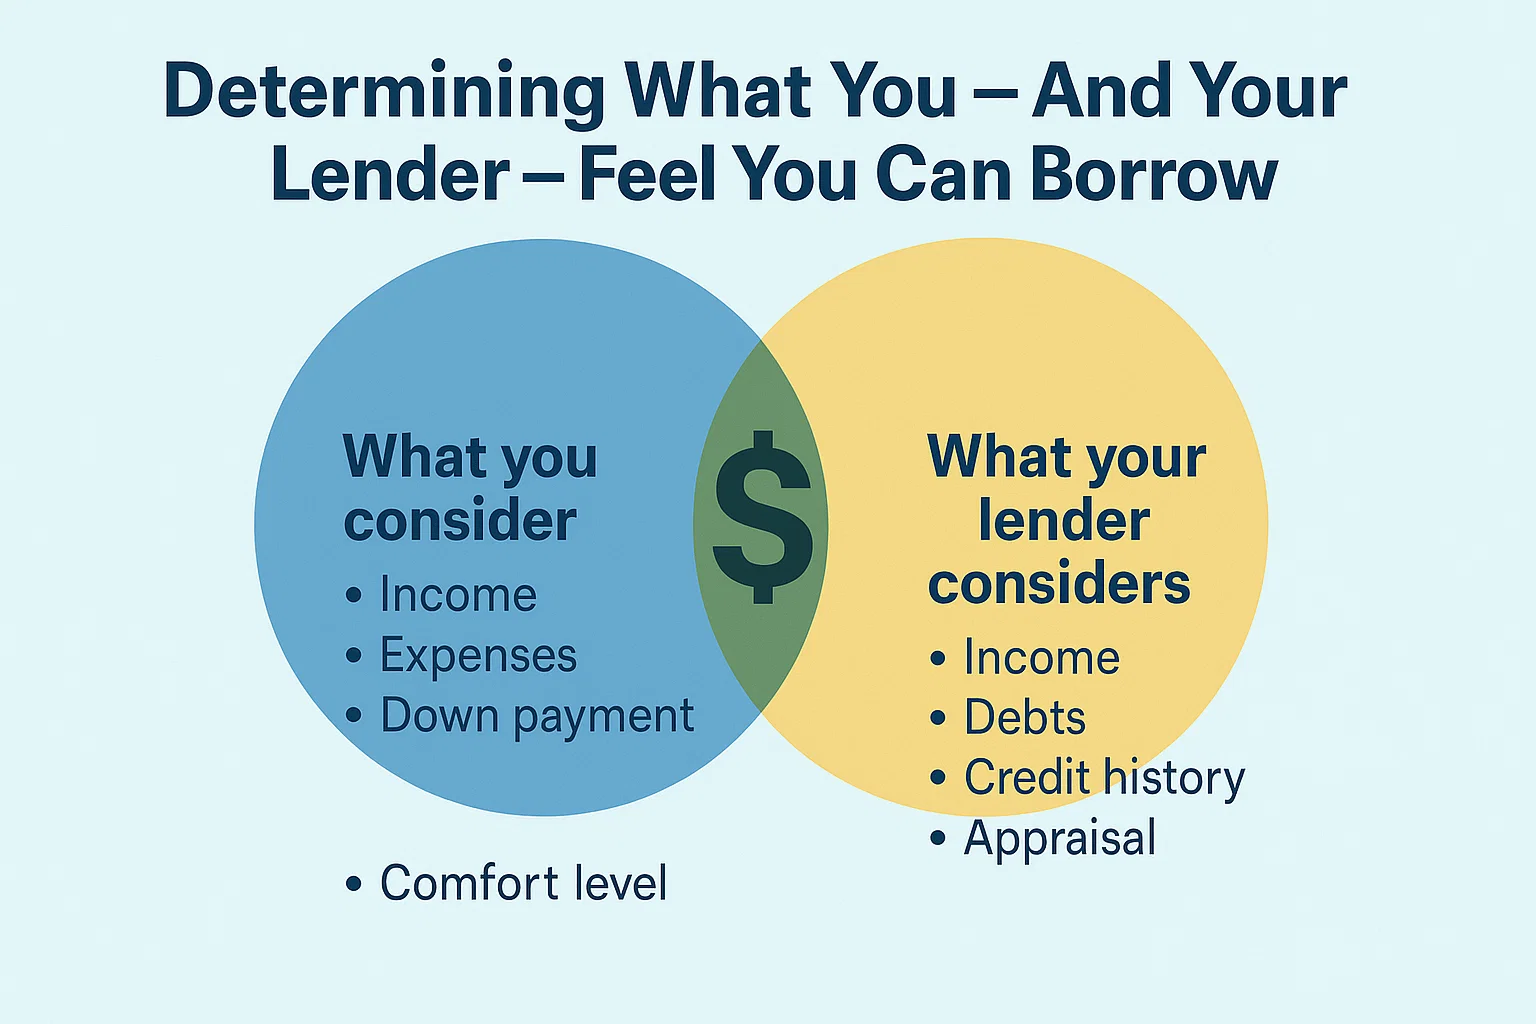
For anyone thinking about purchasing a home, it’s the most fundamental question: How much mortgage can you afford? Put another way, with today’s interest rates, tough underwriting rules, and the down payment cash you can put together, what mortgage amount might a lender approve you for, given your income, debts, and credit scores?
Many home shoppers opt for a “quick fix” answer by visiting websites that provide an online mortgage calculator. That’s fine, except that simply entering your monthly income, expenses, and what you believe to be your credit score in a computer program won’t accurately predict what a specific lender will actually agree to lend you. This is because there are many factors that play a role in calculating a mortgage loan. More important, an online calculator won’t give you insights into the often flexible, case-by-case factors that lenders use to get your loan application approved.
How to Determine What You Can Afford
Mortgage Secret #1: Ratios Are Hugely Important
Every mortgage lender uses debt-to-income (DTI) ratios to arrive at a baseline judgment about your financial capacity to repay a loan. The idea is to measure your gross monthly household income and compare it to two types of debt:
- The money you spend each month on core housing-related expenses combined;
- The amount you spend on non-housing debts, such as credit cards, auto loans, student loans, etc.
Your Housing Ratio
Key housing costs include principal, interest, property taxes, hazard insurance, homeowners association fees, and additional required fees (e.g., flood insurance). For example, if your housing costs total $1,800 a month and your gross income is $6,000, your housing ratio is 30% ($1,800/$6,000). Most lenders consider this acceptable if total debts are manageable.
Your Total Debt Ratio
This ratio includes housing expenses plus all other recurring debts. Using the $6,000 income example, total debt payments of $2,460/month result in a 41% DTI, which is generally acceptable. At 45% or higher, approval becomes borderline, and above 50%, conventional loans may be denied—though FHA loans could still be an option.
Mortgage Secret #2: Loan Types Matter a Lot
The type of mortgage you choose impacts affordability. Major loan types include:
- Conventional: Requires higher down payments and stricter standards.
- FHA Loan: Designed for first-time buyers or those with lower credit scores (3.5% down payment minimum).
- VA Loans: Zero-down options for military personnel.
- USDA Loans: For rural homebuyers with tight credit access.
The Biggest Mortgage Secret: Automated Underwriting
Mortgage approvals often hinge on two automated systems: Loan Prospector (LP) and Desktop Underwriter (DU). These systems analyze credit reports, income, assets, debt ratios, and loan type to generate approval decisions. Skilled loan officers can adjust your application (e.g., improving credit utilization) to secure approval, even with higher DTIs.
Other Key Factors to Mortgage Loans
Income
Lenders may consider side income, rental revenue, investment gains, alimony, or retirement account distributions if documented and stable.
Credit Scores
Only FICO scores matter in automated underwriting. Scores below 640 may lead to higher fees or denials, though compensating factors (e.g., strong employment history) can help.
Closing Costs
These typically range from 2% to 5% of the home price. Sellers or builders may cover up to 3% (conventional loans) or 6% (FHA) of these costs.
Can You Afford That Home?
While lenders provide a borrowing limit, your personal budget should dictate final decisions. Consider future expenses (e.g., education, weddings) that underwriting doesn’t account for. Use the insights above to align your financial goals with lender requirements and make an informed choice.